This document covers federally regulated pipelines only. Any non-federally regulated pipeline data reported to the Transportation Safety Board of Canada (TSB) are not included in this report.
The TSB gathers and uses these data during the course of its investigations to analyze safety deficiencies and identify risks in the Canadian pipeline transportation system.
It should be noted that certain characteristics of the data constrain statistical analysis and identification of emerging trends. These include the small totals of accidents and incidents, the large variability in the data from year to year, and changes to regulations and definitions over time. The reader is cautioned to keep these limitations in mind when viewing this summary to avoid drawing conclusions that cannot be supported by statistical analysis.
The 2021 data were collected according to the reporting requirements described in the Transportation Safety Board Regulations in force during that calendar year.Footnote 1
The statistics presented here reflect the TSB Pipeline Occurrence Database System (PODS) on February 15, 2022. Since the occurrence data are constantly being updated in the live database as additional information becomes available, the statistics may change slightly over time.
Also, as many occurrences are not formally investigated, information regarding some of the reported occurrences recorded in the database may not have been verified by the TSB.
The pipeline system
In the federally regulated pipeline system in 2021, 99 companies transported either oil or gas, or both, through approximately 21 300 km of oil pipelines and approximately 48 000 km of gas pipelines. A further 100 km of pipelines carried other commodities and substances. Altogether, this represents approximately 17.4 exajoules (EJ) of energy content transported.Footnote 2
Pipeline transportation occurrences
In 2021, 115 pipeline transportation occurrences were reported to the TSB (Table 1 and Figure 1). This number is similar to the average number of occurrences for the previous 10 years (117 occurrences) and is the highest number of occurrences since 2017 (when there were 131 occurrences). Fluctuations to the reported numbers over this period may have resulted from various factors, including changes to regulations and definitions. Among all occurrences in 2021, two were accidents; these were the first accidents since 2018 (when there was one accident) and the most accidents since 2017 (when there were four accidents). From 2011 to 2020, however, there was an average of three accidents per year.
As in previous years since 2017, in 2021 there were no serious injuries or fatalities arising directly from the operation of a federally regulated pipeline. Indeed, there have been no fatal accidents on a federally regulated pipeline system directly resulting from the operation of a pipeline since the inception of the TSB in 1990.
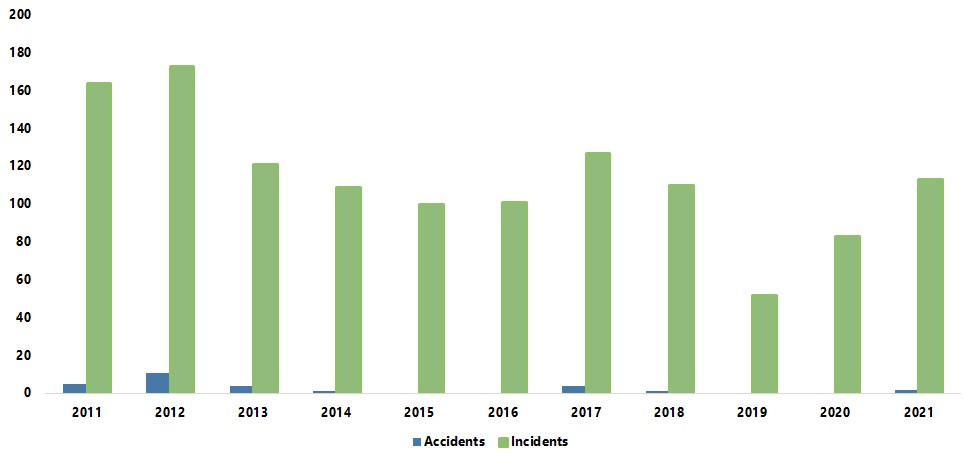
Figure 1. Data table
| Year | Number of accidents | Number of incidents |
|---|---|---|
| 2011 | 5 | 164 |
| 2012 | 11 | 173 |
| 2013 | 4 | 121 |
| 2014 | 1 | 109 |
| 2015 | 0 | 100 |
| 2016 | 0 | 101 |
| 2017 | 4 | 127 |
| 2018 | 1 | 110 |
| 2019 | 0 | 52 |
| 2020 | 0 | 83 |
| 2021 | 2 | 113 |
Release of product
Of the 115 occurrences in 2021, 23 involved a release of product (Table 5), far lower than the average of 77 per year over the previous 10 years. The products released in these occurrences were as follows (Figure 2): 13 occurrences (one accident and 12 incidents) released hydrocarbon gas: sweet natural gas in each case. Also, low vapour pressure (LVP) hydrocarbons were released in three incidents, all involving crude oil. Seven occurrences (one accident and six incidents) resulted in the release of a liquid other than hydrocarbons, namely pulp process water (in all cases). In 2021, 92 occurrences did not involve a release of product, more than twice the average number of occurrences without release over the previous 10 years (41).
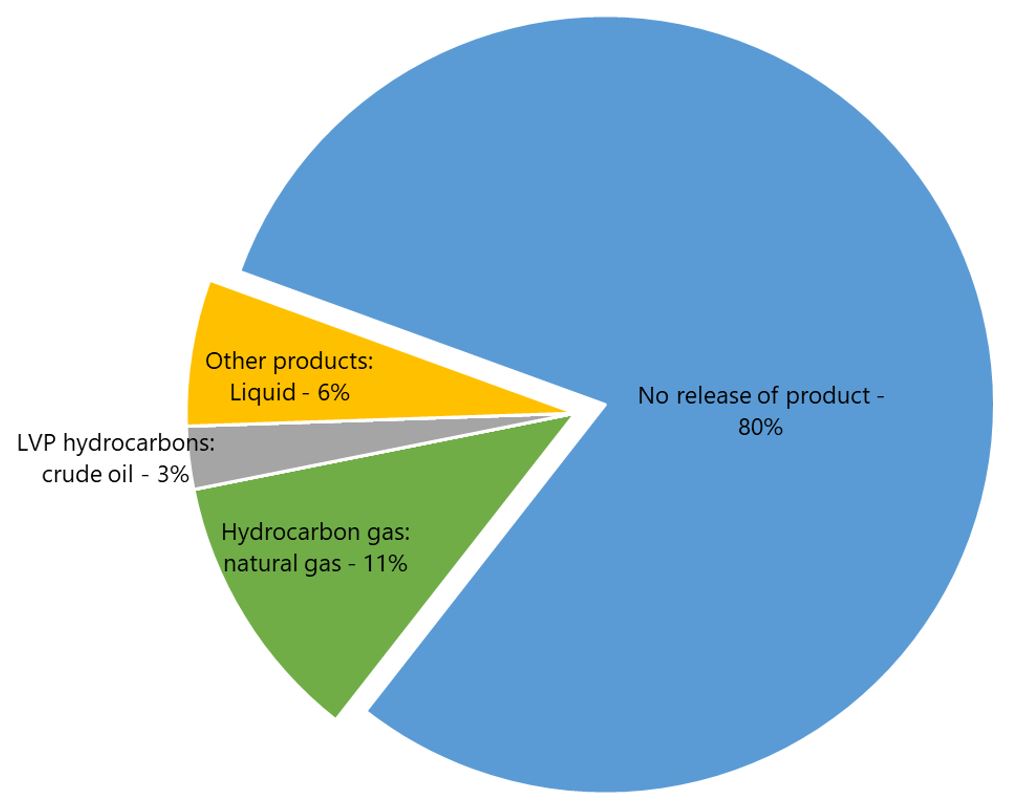
Figure 2. Data table
| Product released | Number of occurrences |
|---|---|
| Total occurences | 115 |
| Gas - sour or acid | 0 |
| Hydrocarbon gas: natural gas | 13 |
| Natural gas liquids / liquefied petroleum gas | 0 |
| LVP hydrocarbons: condensate | 0 |
| LVP hydrocarbons: condensate - sour | 0 |
| LVP hydrocarbons: crude oil | 3 |
| LVP hydrocarbons: crude oil - sour | 0 |
| LVP hydrocarbons: refined products | 0 |
| Other products: gas | 0 |
| Other products: liquid | 7 |
| No release of product | 92 |
Events other than product release
In 2021, 55 occurrences (48% of 115 total occurrences) involved “geotechnical, hydrotechnical or environmental activity,” for example, slope movements or river erosion that exposed a length of pipe (Table 1 and Figure 3). This was the highest level reported over the past 10 years; previously the 45 occurrences reported in 2018 had been the highest level. The increase in this incident type may be related to the unusual weather patterns observed in 2021, particularly in Western Canada. In addition to weather-related factors, the fluctuations in this incident type since 2017 might be related to variations in enforcement and company inspection and reporting practices. Only two incidents involved “operation of the pipeline beyond limits”, well below the average of 14 occurrences of this type over the previous 10 years. There were 12 reports of pipelines being contacted by an object in 2021 (one accident and 11 incidents) compared with the average of seven reports per year during the previous 10 years; there were also 15 incidents where “unauthorized third-party activity affects pipeline structural integrity,” compared with an average of two such incidents per year over the previous 10 years. Finally, 12 fires were reported in 2021 (more than twice the 10-year average of 5) and no explosions were reported (down from two in 2020).
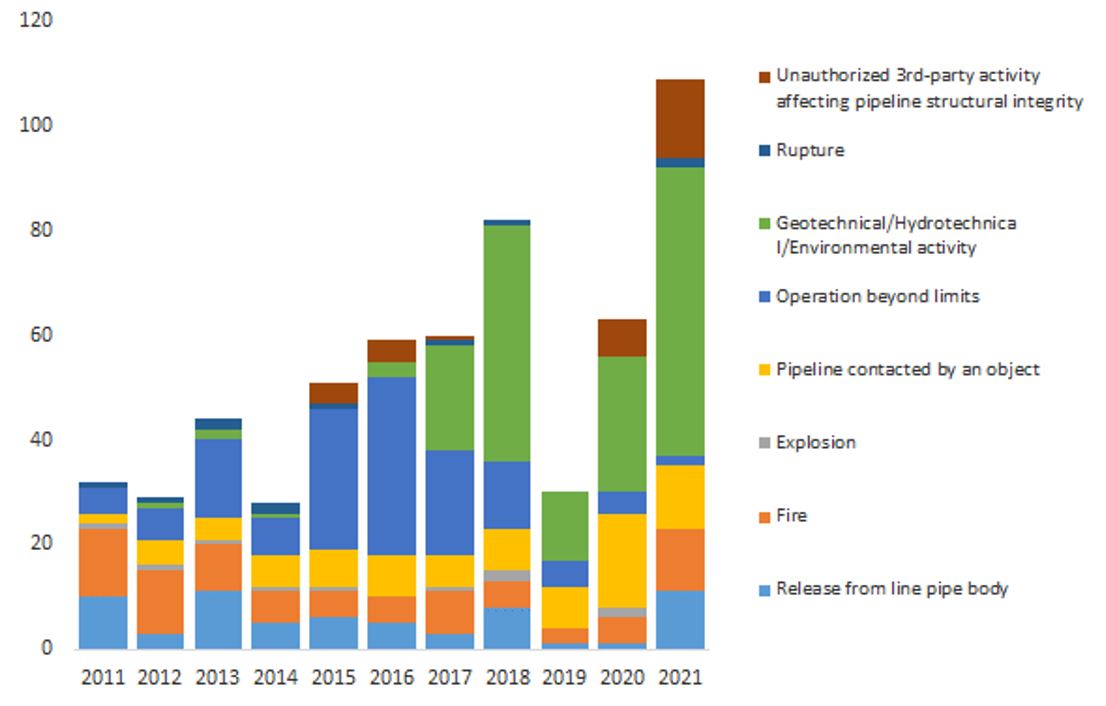
Figure 3. Data table
| Year | Release from line pipe body | Fire | Explosion | Pipeline contacted by an object | Operation beyond limits | Geotechnical/Hydrotechnica l/Environmental activity | Rupture | Unauthorized 3rd-party activity affecting pipeline structural integrity |
|---|---|---|---|---|---|---|---|---|
| 2011 | 10 | 13 | 1 | 2 | 5 | 0 | 1 | 0 |
| 2012 | 3 | 12 | 1 | 5 | 6 | 1 | 1 | 0 |
| 2013 | 11 | 9 | 1 | 4 | 15 | 2 | 2 | 0 |
| 2014 | 5 | 6 | 1 | 6 | 7 | 1 | 2 | 0 |
| 2015 | 6 | 5 | 1 | 7 | 27 | 0 | 1 | 4 |
| 2016 | 5 | 5 | 0 | 8 | 34 | 3 | 0 | 4 |
| 2017 | 3 | 8 | 1 | 6 | 20 | 20 | 1 | 1 |
| 2018 | 8 | 5 | 2 | 8 | 13 | 45 | 1 | 0 |
| 2019 | 1 | 3 | 0 | 8 | 5 | 13 | 0 | 0 |
| 2020 | 1 | 5 | 2 | 18 | 4 | 26 | 0 | 7 |
| 2021 | 11 | 12 | 0 | 12 | 2 | 55 | 2 | 15 |
Geography
The largest number of occurrences in 2021 (46 out of 115) took place in British Columbia (Table 2); this is an increase from 15 occurrences in 2020, and accounts for the entire national increase in the number of occurrences. It is noteworthy that British Columbia had also reported the most occurrences in certain previous years characterized by high geotechnical activity (2017 and 2018), a sensitivity to this incident type not observed in other provinces. Alberta had 28 occurrences in 2021, down from 29 in 2020, and Ontario had 16, down from 20 in 2020. Quebec had 10 occurrences and New Brunswick had eight – seven of these (six incidents and one accident) involved pulp process water pipelines. Saskatchewan had four occurrences (all incidents) and Manitoba had two, including one incident and one accident. The Northwest Territories had one occurrence (also an incident) in 2021.
Facilities
As in 2020, a majority of occurrences in 2021 (79%; 91 of 115) occurred at locations along pipeline, while 21% (24 of 115) occurred at facilities (Figure 4). This is in direct contrast to the aggregate totals across the 10-year period 2011–2020, where there were 717 occurrences (61%) at facilities and 456 (39%) at locations along pipeline (Table 3). The greater proportion of occurrences along pipeline seen in 2021 is due in part to the large number of reports of geotechnical, hydrotechnical or environmental activity that affected sections of pipeline during the year. Of the 24 occurrences (all incidents) at facilities in 2021, 14 occurred at compressor stations, three at terminals, one at a pump station, one at a meter station, and five at other facilities.
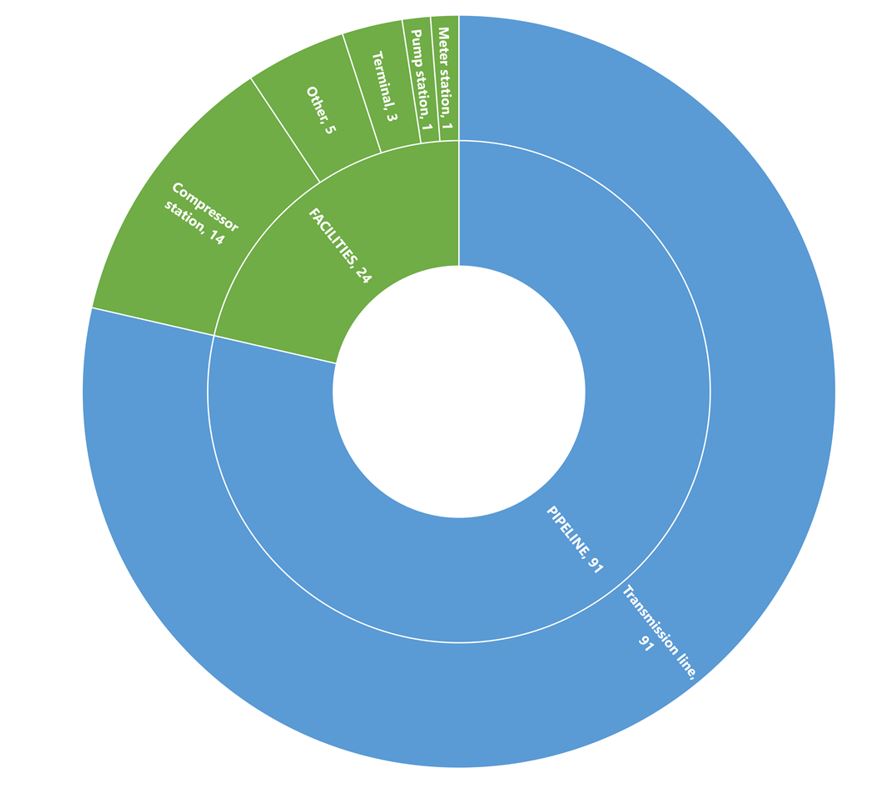
Figure 4. Data table
| Facility or pipeline | Facility type or pipeline type | Occurrences | Accidents | Incidents |
|---|---|---|---|---|
| FACILITIES, 24 | Compressor station | 14 | 0 | 14 |
| Gas processing plant | 0 | 0 | 0 | |
| Meter station | 1 | 0 | 1 | |
| Pump station | 1 | 0 | 1 | |
| Storage facility | 0 | 0 | 0 | |
| Terminal | 3 | 0 | 3 | |
| Receipt / Delivery facility | 0 | 0 | 0 | |
| Other | 5 | 0 | 5 | |
| PIPELINE, 91 | Gathering line | 0 | 0 | 0 |
| Transmission line | 91 | 2 | 89 |
Pipeline occurrence rate
An occurrence rate of 1.7 occurrences per 1 000 km of operating pipeline was calculated for 2021 based on the 115 occurrences reported and the 69 400 km of federally regulated pipelines that were operational in Canada according to the Canada Energy Regulator (CER) during the same year (Table 4 and Figure 5). This occurrence rate is up from 1.2 in 2020, and equal to the average of 1.7 in the 10-year period 2011 to 2020.
An occurrence rate can also be calculated using exajoules (EJ) of energy as a denominator (Table 4 and Figure 5). In 2021, the equivalent of 17.4 EJ of energy were transported in federally regulated pipelines. This translates to a rate of 6.6 occurrences per EJ in 2021, a figure higher than the 2020 rate of 4.9, but below the 2011–2020 average of 7.5 occurrences per EJ.
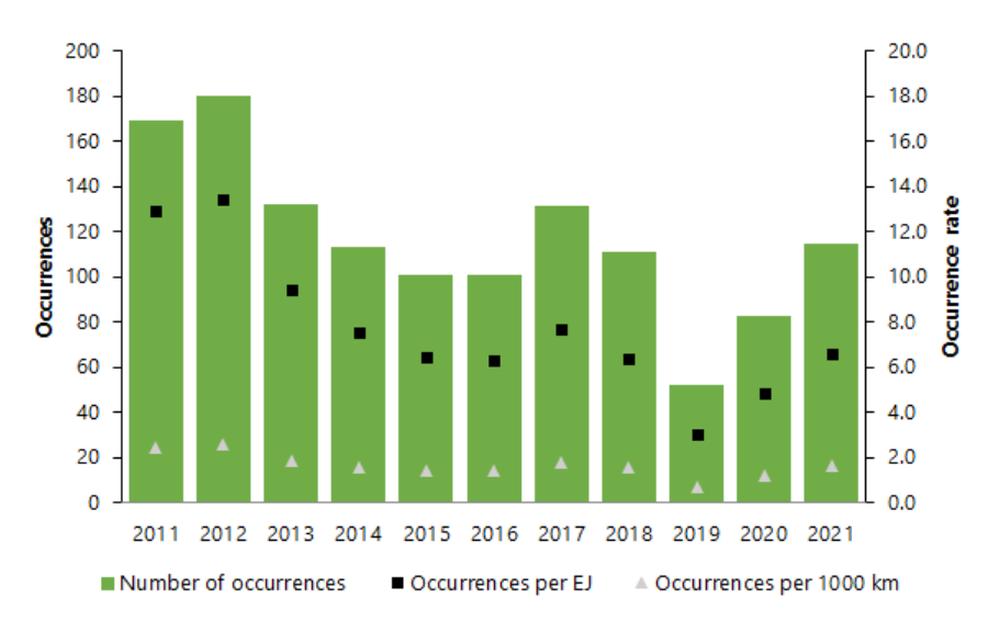
Figure 5. Data table
| Year | Number of occurrences | Occurrences per EJ | Occurrences per 1000 km |
|---|---|---|---|
| 2011 | 169 | 12.9 | 2.5 |
| 2012 | 180 | 13.4 | 2.6 |
| 2013 | 132 | 9.4 | 1.9 |
| 2014 | 113 | 7.5 | 1.6 |
| 2015 | 101 | 6.4 | 1.4 |
| 2016 | 101 | 6.3 | 1.4 |
| 2017 | 131 | 7.7 | 1.8 |
| 2018 | 111 | 6.3 | 1.6 |
| 2019 | 52 | 3.0 | 0.7 |
| 2020 | 83 | 4.9 | 1.2 |
| 2021 | 115 | 6.6 | 1.7 |
Data tables
| 2011 | 2012 | 2013 | 2014 | 2015 | 2016 | 2017 | 2018 | 2019 | 2020 | 2021 | |
|---|---|---|---|---|---|---|---|---|---|---|---|
| Occurrences | 169 | 180 | 132 | 113 | 101 | 101 | 131 | 111 | 52 | 83 | 115 |
| Occurrences with product release | 149 | 156 | 107 | 94 | 60 | 41 | 75 | 41 | 23 | 19 | 23 |
| Persons fatally injured | 0 | 0 | 0 | 0 | 0 | 0 | 0 | 0 | 0 | 0 | 0 |
| Persons seriously injured | 0 | 2 | 0 | 0 | 0 | 0 | 1 | 0 | 0 | 0 | 0 |
| Accidents | 5 | 7 | 11 | 4 | 1 | 0 | 4 | 1 | 0 | 0 | 2 |
| Product released | 4 | 3 | 7 | 2 | 1 | 0 | 4 | 1 | 0 | 0 | 2 |
| Release of hydrocarbon gas | 2 | 3 | 5 | 2 | 1 | 0 | 0 | 1 | 0 | 0 | 1 |
| Release of HVP hydrocarbons1 | 0 | 0 | 0 | 0 | 0 | 0 | 1 | 0 | 0 | 0 | 0 |
| Release of LVP hydrocarbons2, 3 | 2 | 0 | 2 | 0 | 0 | 0 | 2 | 0 | 0 | 0 | 0 |
| Release of other product4 | 0 | 0 | 0 | 0 | 0 | 0 | 1 | 0 | 0 | 0 | 1 |
| Release from line pipe body | 2 | 1 | 2 | 2 | 1 | 0 | 1 | 1 | 0 | 0 | 2 |
| Fire | 3 | 6 | 8 | 3 | 0 | 0 | 0 | 1 | 0 | 0 | 0 |
| Explosion | 1 | 1 | 1 | 1 | 0 | 0 | 0 | 1 | 0 | 0 | 0 |
| Rupture | 1 | 1 | 2 | 2 | 1 | 0 | 1 | 1 | 0 | 0 | 2 |
| Pipeline contacted by an object | 1 | 1 | 1 | 0 | 0 | 0 | 2 | 0 | 0 | 0 | 1 |
| Operation beyond limits | 0 | 0 | 0 | 0 | 0 | 0 | 0 | 0 | 0 | 0 | 0 |
| Geotechnical/hydrotechnical/environmental activity | 0 | 0 | 0 | 0 | 0 | 0 | 0 | 0 | 0 | 0 | 0 |
| Incidents | 164 | 173 | 121 | 109 | 100 | 101 | 127 | 110 | 52 | 83 | 113 |
| Product released | 145 | 153 | 100 | 92 | 59 | 41 | 71 | 40 | 23 | 19 | 21 |
| Release of hydrocarbon gas | 59 | 67 | 47 | 31 | 30 | 35 | 47 | 35 | 18 | 13 | 12 |
| Release of HVP hydrocarbons1 | 5 | 2 | 5 | 7 | 8 | 4 | 10 | 1 | 0 | 1 | 0 |
| Release of LVP hydrocarbons2, 3 | 72 | 78 | 35 | 36 | 4 | 1 | 3 | 4 | 5 | 4 | 3 |
| Release of other product4 | 9 | 6 | 13 | 18 | 17 | 1 | 11 | 0 | 0 | 1 | 6 |
| Release from line pipe body | 8 | 2 | 9 | 3 | 5 | 5 | 2 | 7 | 1 | 1 | 9 |
| Fire | 10 | 6 | 1 | 3 | 5 | 5 | 8 | 4 | 3 | 5 | 12 |
| Explosion | 0 | 0 | 0 | 0 | 1 | 0 | 1 | 1 | 0 | 2 | 0 |
| Pipeline contacted by an object | 1 | 4 | 3 | 6 | 7 | 8 | 4 | 8 | 8 | 18 | 11 |
| Operation beyond limits | 5 | 6 | 15 | 7 | 27 | 34 | 20 | 13 | 5 | 4 | 2 |
| Geotechnical/hydrotechnical/environmental activity | 0 | 1 | 2 | 1 | 0 | 3 | 20 | 45 | 13 | 26 | 55 |
| Unauthorized third-party activity affecting pipeline structural integrity | 0 | 0 | 0 | 0 | 4 | 4 | 1 | 0 | 0 | 7 | 15 |
Data extracted 15 February 2022 1 HVP: high vapour pressure as defined in Canadian Standards Association Standard Z662. |
|||||||||||
| 2011 | 2012 | 2013 | 2014 | 2015 | 2016 | 2017 | 2018 | 2019 | 2020 | 2021 | |
|---|---|---|---|---|---|---|---|---|---|---|---|
| Accidents | 5 | 7 | 11 | 4 | 1 | 0 | 4 | 1 | 0 | 0 | 2 |
| Newfoundland and Labrador | 0 | 0 | 0 | 0 | 0 | 0 | 0 | 0 | 0 | 0 | 0 |
| Prince Edward Island | 0 | 0 | 0 | 0 | 0 | 0 | 0 | 0 | 0 | 0 | 0 |
| Nova Scotia | 0 | 0 | 0 | 0 | 0 | 0 | 0 | 0 | 0 | 0 | 0 |
| New Brunswick | 0 | 0 | 0 | 0 | 0 | 0 | 0 | 0 | 0 | 0 | 1 |
| Quebec | 0 | 0 | 0 | 0 | 0 | 0 | 0 | 0 | 0 | 0 | 0 |
| Ontario | 2 | 2 | 2 | 0 | 0 | 0 | 0 | 0 | 0 | 0 | 0 |
| Manitoba | 0 | 0 | 0 | 1 | 0 | 0 | 0 | 0 | 0 | 0 | 1 |
| Saskatchewan | 1 | 1 | 1 | 0 | 0 | 0 | 1 | 0 | 0 | 0 | 0 |
| Alberta | 1 | 2 | 6 | 1 | 1 | 0 | 2 | 0 | 0 | 0 | 0 |
| British Columbia | 0 | 2 | 2 | 1 | 0 | 0 | 1 | 1 | 0 | 0 | 0 |
| Yukon | 0 | 0 | 0 | 0 | 0 | 0 | 0 | 0 | 0 | 0 | 0 |
| Northwest Territories | 1 | 0 | 0 | 1 | 0 | 0 | 0 | 0 | 0 | 0 | 0 |
| Nunavut | 0 | 0 | 0 | 0 | 0 | 0 | 0 | 0 | 0 | 0 | 0 |
| Incidents | 164 | 173 | 121 | 109 | 100 | 101 | 127 | 110 | 52 | 83 | 113 |
| Newfoundland and Labrador | 0 | 0 | 0 | 0 | 0 | 0 | 0 | 0 | 0 | 0 | 0 |
| Prince Edward Island | 0 | 0 | 0 | 0 | 0 | 0 | 0 | 0 | 0 | 0 | 0 |
| Nova Scotia | 4 | 2 | 3 | 1 | 2 | 3 | 0 | 2 | 0 | 1 | 0 |
| New Brunswick | 13 | 19 | 16 | 9 | 3 | 5 | 4 | 2 | 0 | 1 | 7 |
| Quebec | 2 | 1 | 3 | 1 | 8 | 7 | 6 | 1 | 5 | 7 | 10 |
| Ontario | 22 | 22 | 11 | 14 | 14 | 18 | 15 | 19 | 6 | 20 | 16 |
| Manitoba | 11 | 10 | 12 | 8 | 9 | 2 | 3 | 3 | 2 | 4 | 1 |
| Saskatchewan | 35 | 45 | 18 | 17 | 5 | 6 | 11 | 4 | 2 | 5 | 4 |
| Alberta | 54 | 45 | 35 | 32 | 27 | 37 | 36 | 32 | 22 | 29 | 28 |
| British Columbia | 11 | 18 | 17 | 27 | 30 | 22 | 52 | 47 | 12 | 15 | 46 |
| Yukon | 0 | 0 | 0 | 0 | 0 | 0 | 0 | 0 | 0 | 0 | 0 |
| Northwest Territories | 12 | 11 | 6 | 0 | 2 | 1 | 0 | 0 | 3 | 1 | 1 |
| Nunavut | 0 | 0 | 0 | 0 | 0 | 0 | 0 | 0 | 0 | 0 | 0 |
| Occurrences | 169 | 180 | 132 | 113 | 101 | 101 | 131 | 111 | 52 | 83 | 115 |
| Data extracted 15 February 2022 | |||||||||||
| 2011 | 2012 | 2013 | 2014 | 2015 | 2016 | 2017 | 2018 | 2019 | 2020 | 2021 | ||
|---|---|---|---|---|---|---|---|---|---|---|---|---|
| Accidents | 5 | 7 | 11 | 4 | 1 | 0 | 4 | 1 | 0 | 0 | 2 | |
| Facilities | 3 | 6 | 8 | 1 | 0 | 0 | 2 | 0 | 0 | 0 | 0 | |
| Compressor station | 0 | 3 | 4 | 1 | 0 | 0 | 0 | 0 | 0 | 0 | 0 | |
| Gas processing plant | 0 | 0 | 2 | 0 | 0 | 0 | 1 | 0 | 0 | 0 | 0 | |
| Meter station | 2 | 1 | 0 | 0 | 0 | 0 | 0 | 0 | 0 | 0 | 0 | |
| Pump station | 0 | 2 | 1 | 0 | 0 | 0 | 0 | 0 | 0 | 0 | 0 | |
| Storage facility | 0 | 0 | 0 | 0 | 0 | 0 | 0 | 0 | 0 | 0 | 0 | |
| Terminal | 1 | 0 | 1 | 0 | 0 | 0 | 1 | 0 | 0 | 0 | 0 | |
| Receipt/delivery facility | 0 | 0 | 0 | 0 | 0 | 0 | 0 | 0 | 0 | 0 | 0 | |
| Other | 0 | 0 | 0 | 0 | 0 | 0 | 0 | 0 | 0 | 0 | 0 | |
| Pipeline | 2 | 1 | 3 | 3 | 1 | 0 | 2 | 1 | 0 | 0 | 2 | |
| Gathering line | 0 | 1 | 0 | 0 | 0 | 0 | 0 | 0 | 0 | 0 | 0 | |
| Transmission line | 2 | 0 | 3 | 3 | 1 | 0 | 2 | 1 | 0 | 0 | 2 | |
| Incidents | 164 | 173 | 121 | 109 | 100 | 101 | 127 | 110 | 52 | 83 | 113 | |
| Facilities | 126 | 132 | 86 | 88 | 67 | 48 | 67 | 41 | 20 | 22 | 24 | |
| Compressor station | 22 | 31 | 15 | 14 | 11 | 12 | 23 | 18 | 6 | 8 | 14 | |
| Gas processing plant | 3 | 6 | 11 | 21 | 21 | 3 | 20 | 7 | 3 | 0 | 0 | |
| Meter station | 18 | 17 | 19 | 9 | 7 | 16 | 7 | 6 | 3 | 2 | 1 | |
| Pump station | 48 | 37 | 19 | 22 | 17 | 9 | 10 | 4 | 4 | 8 | 1 | |
| Storage facility | 1 | 1 | 0 | 0 | 0 | 0 | 1 | 0 | 0 | 0 | 0 | |
| Terminal | 27 | 35 | 19 | 18 | 10 | 5 | 6 | 6 | 3 | 3 | 3 | |
| Receipt/delivery facility | 1 | 0 | 1 | 1 | 0 | 0 | 0 | 0 | 0 | 0 | 0 | |
| Other | 6 | 5 | 2 | 3 | 1 | 3 | 0 | 0 | 1 | 1 | 5 | |
| Pipeline | 38 | 41 | 35 | 21 | 33 | 53 | 60 | 69 | 32 | 61 | 89 | |
| Gathering line | 7 | 8 | 2 | 2 | 5 | 3 | 8 | 11 | 3 | 1 | 0 | |
| Transmission line | 31 | 33 | 33 | 19 | 28 | 50 | 52 | 58 | 29 | 60 | 89 | |
| Occurrences | 169 | 180 | 132 | 113 | 101 | 101 | 131 | 111 | 52 | 83 | 115 | |
| Data extracted 15 February 2022 | ||||||||||||
| 2011 | 2012 | 2013 | 2014 | 2015 | 2016 | 2017 | 2018 | 2019 | 2020 | 2021 | |||
|---|---|---|---|---|---|---|---|---|---|---|---|---|---|
| Accidents | 5 | 7 | 11 | 4 | 1 | 0 | 4 | 1 | 0 | 0 | 2 | ||
| Incidents | 164 | 173 | 121 | 109 | 100 | 101 | 127 | 110 | 52 | 83 | 113 | ||
| Occurrences | 169 | 180 | 132 | 113 | 101 | 101 | 131 | 111 | 52 | 83 | 115 | ||
| Total length of operating pipelines1 (x1000 km) | 68.7 | 69.7 | 70.8 | 70.7 | 70.8 | 71.0 | 70.7 | 70.6 | 70.9 | 68.7 | 69.4 | ||
| Accidents per 1000 km of operating pipelines | 0.1 | 0.1 | 0.2 | 0.1 | 0.0 | 0.0 | 0.1 | 0.0 | 0.0 | 0.0 | 0.0 | ||
| Incidents per 1000 km of operating pipelines | 2.4 | 2.5 | 1.7 | 1.5 | 1.4 | 1.4 | 1.8 | 1.6 | 0.7 | 1.2 | 1.6 | ||
| Occurrences per 1000 km of operating pipelines | 2.5 | 2.6 | 1.9 | 1.6 | 1.4 | 1.4 | 1.8 | 1.6 | 0.7 | 1.2 | 1.7 | ||
| Total exajoules of energy transported1 (EJ) | 13.1 | 13.4 | 14.0 | 15.0 | 15.7 | 16.0 | 16.8 | 17.5 | 17.3 | 16.6 | 17.4 | ||
| Accidents per EJ | 0.4 | 0.5 | 0.8 | 0.3 | 0.1 | 0.0 | 0.2 | 0.1 | 0.0 | 0.0 | 0.1 | ||
| Incidents per EJ | 12.5 | 12.9 | 8.6 | 7.3 | 6.4 | 6.3 | 7.4 | 6.3 | 3.0 | 4.9 | 6.5 | ||
| Occurrences per EJ | 12.9 | 13.4 | 9.4 | 7.5 | 6.4 | 6.3 | 7.7 | 6.3 | 3.0 | 4.9 | 6.6 | ||
Data extracted 15 February 2022 |
|||||||||||||
| 2011 | 2012 | 2013 | 2014 | 2015 | 2016 | 2017 | 2018 | 2019 | 2020 | 2021 | |
|---|---|---|---|---|---|---|---|---|---|---|---|
| Hydrocarbon gas | 61 | 70 | 52 | 33 | 31 | 35 | 47 | 36 | 18 | 13 | 13 |
| Gas - sour or acid | 3 | 5 | 3 | 3 | 10 | 2 | 7 | 6 | 1 | 0 | 0 |
| Natural gas | 58 | 65 | 49 | 30 | 21 | 33 | 40 | 30 | 17 | 13 | 13 |
| HVP hydrocarbons1 | 5 | 2 | 5 | 7 | 8 | 4 | 11 | 1 | 0 | 1 | 0 |
| Natural gas liquids / Liquefied petroleum gas | 5 | 2 | 5 | 7 | 8 | 4 | 11 | 1 | 0 | 1 | 0 |
| LVP hydrocarbons2,3 | 74 | 78 | 37 | 36 | 4 | 1 | 5 | 4 | 5 | 4 | 3 |
| Condensate | 0 | 0 | 3 | 4 | 0 | 0 | 1 | 0 | 0 | 1 | 0 |
| Condensate - sour | 0 | 0 | 0 | 0 | 0 | 0 | 0 | 0 | 0 | 0 | 0 |
| Crude oil | 74 | 77 | 33 | 32 | 3 | 1 | 4 | 3 | 5 | 3 | 3 |
| Crude oil - sour | 0 | 0 | 1 | 0 | 1 | 0 | 0 | 0 | 0 | 0 | 0 |
| Refined products | 0 | 1 | 0 | 0 | 0 | 0 | 0 | 1 | 0 | 0 | 0 |
| Other products4 | 9 | 6 | 13 | 18 | 17 | 1 | 12 | 0 | 0 | 1 | 7 |
| Other - unspecified | 9 | 6 | 13 | 18 | 16 | 1 | 0 | 0 | 0 | 0 | 0 |
| Other - gas | 0 | 0 | 0 | 0 | 1 | 0 | 1 | 0 | 0 | 0 | 0 |
| Other - liquid | 0 | 0 | 0 | 0 | 0 | 0 | 11 | 0 | 0 | 1 | 7 |
| Occurrences | 149 | 156 | 107 | 94 | 60 | 41 | 75 | 41 | 23 | 19 | 23 |
Data extracted 15 February 2022 |
|||||||||||
| 2011 | 2012 | 2013 | 2014 | 2015 | 2016 | 2017 | 2018 | 2019 | 2020 | 2021 | ||
|---|---|---|---|---|---|---|---|---|---|---|---|---|
| Hydrocarbon gas | 61 | 70 | 52 | 33 | 31 | 35 | 47 | 36 | 18 | 13 | 13 | |
| 100 m3 or less | 54 | 69 | 48 | 26 | 20 | 24 | 20 | 15 | 11 | 8 | 5 | |
| 101 to 30,000 m3 | 5 | 0 | 3 | 5 | 7 | 10 | 25 | 17 | 4 | 3 | 3 | |
| 30,001 to 100,000 m3 | 0 | 0 | 0 | 0 | 3 | 1 | 1 | 1 | 1 | 0 | 2 | |
| 100,001 to 1,000,000 m3 | 1 | 1 | 0 | 1 | 0 | 0 | 1 | 2 | 2 | 1 | 3 | |
| 1,000,001 to 10,000,000 m3 | 1 | 0 | 0 | 1 | 1 | 0 | 0 | 1 | 0 | 0 | 0 | |
| Greater than 10,000,000 m3 | 0 | 0 | 1 | 0 | 0 | 0 | 0 | 0 | 0 | 1 | 0 | |
| HVP hydrocarbons1 | 5 | 2 | 5 | 7 | 8 | 4 | 11 | 1 | 0 | 1 | 0 | |
| 8 m3 or less | 4 | 2 | 5 | 7 | 8 | 4 | 10 | 1 | 0 | 1 | 0 | |
| 9 to 25 m3 | 0 | 0 | 0 | 0 | 0 | 0 | 1 | 0 | 0 | 0 | 0 | |
| 26 to 100 m3 | 1 | 0 | 0 | 0 | 0 | 0 | 0 | 0 | 0 | 0 | 0 | |
| 101 to 1000 m3 | 0 | 0 | 0 | 0 | 0 | 0 | 0 | 0 | 0 | 0 | 0 | |
| 1001 to 10,000 m3 | 0 | 0 | 0 | 0 | 0 | 0 | 0 | 0 | 0 | 0 | 0 | |
| Greater than 10,000 m3 | 0 | 0 | 0 | 0 | 0 | 0 | 0 | 0 | 0 | 0 | 0 | |
| LVP hydrocarbons2, 3 | 74 | 78 | 37 | 36 | 4 | 1 | 5 | 4 | 5 | 4 | 3 | |
| 1.5 m3 or less | 67 | 76 | 34 | 29 | 0 | 0 | 0 | 2 | 0 | 0 | 1 | |
| 1.6 to 8 m3 | 6 | 1 | 2 | 4 | 2 | 1 | 1 | 2 | 4 | 0 | 1 | |
| 9 to 25 m3 | 0 | 0 | 1 | 2 | 1 | 0 | 2 | 0 | 0 | 0 | 0 | |
| 26 to 100 m3 | 0 | 1 | 0 | 0 | 1 | 0 | 1 | 0 | 1 | 3 | 0 | |
| 101 to 1000 m3 | 1 | 0 | 0 | 1 | 0 | 0 | 0 | 0 | 0 | 1 | 0 | |
| 1001 to 10,000 m3 | 0 | 0 | 0 | 0 | 0 | 0 | 1 | 0 | 0 | 0 | 0 | |
| Greater than 10,000 m3 | 0 | 0 | 0 | 0 | 0 | 0 | 0 | 0 | 0 | 0 | 1 | |
| Other products4 | 9 | 6 | 13 | 18 | 17 | 1 | 12 | 0 | 0 | 1 | 7 | |
| 8 m3 or less | 9 | 6 | 13 | 15 | 14 | 0 | 12 | 0 | 0 | 1 | 3 | |
| 9 to 25 m3 | 0 | 0 | 0 | 2 | 2 | 0 | 0 | 0 | 0 | 0 | 0 | |
| 26 to 100 m3 | 0 | 0 | 0 | 1 | 0 | 0 | 0 | 0 | 0 | 0 | 0 | |
| 101 to 1000 m3 | 0 | 0 | 0 | 0 | 1 | 1 | 0 | 0 | 0 | 0 | 4 | |
| 1001 to 10,000 m3 | 0 | 0 | 0 | 0 | 0 | 0 | 0 | 0 | 0 | 0 | 0 | |
| Greater than 10,000 m3 | 0 | 0 | 0 | 0 | 0 | 0 | 0 | 0 | 0 | 0 | 0 | |
| Occurrences | 149 | 156 | 107 | 94 | 60 | 41 | 75 | 41 | 23 | 19 | 23 | |
| Data extracted 15 February 2022 1 HVP: high vapour pressure as defined in Canadian Standards Association Standard Z662. 2 LVP: means low vapour pressure as defined in Canadian Standards Association Standard Z662. 3 In July 2014, the minimum reporting threshold for releases of low vapour pressure hydrocarbons was established at 1.5 m3. 4 As of January 2017, "other products" are specified to be either liquid or gas. |
||||||||||||
| No release of product | Release of hydrocarbon gas | Release of HVP hydrocarbons1 | Release of LVP hydrocarbons2,3 | Release of other product4 | ||||||
|---|---|---|---|---|---|---|---|---|---|---|
| Province or territory | 2011-2020 average | 2021 | 2011-2020 average | 2021 | 2011-2020 average | 2021 | 2011-2020 average | 2021 | 2011-2020 average | 2021 |
| Newfoundland and Labrador | 0.0 | 0 | 0.0 | 0 | 0.0 | 0 | 0.0 | 0 | 0.0 | 0 |
| Prince Edward Island | 0.0 | 0 | 0.0 | 0 | 0.0 | 0 | 0.0 | 0 | 0.0 | 0 |
| Nova Scotia | 0.1 | 0 | 1.6 | 0 | 0.0 | 0 | 0.0 | 0 | 0.1 | 0 |
| New Brunswick | 0.0 | 0 | 6.9 | 1 | 0.0 | 0 | 0.0 | 0 | 0.3 | 7 |
| Quebec | 3.5 | 9 | 0.4 | 1 | 0.0 | 0 | 0.2 | 0 | 0.0 | 0 |
| Ontario | 9.0 | 16 | 5.4 | 0 | 0.4 | 0 | 1.2 | 0 | 0.7 | 0 |
| Manitoba | 1.6 | 1 | 1.3 | 1 | 0.5 | 0 | 2.8 | 0 | 0.3 | 0 |
| Saskatchewan | 2.0 | 4 | 1.6 | 0 | 1.7 | 0 | 9.5 | 0 | 0.4 | 0 |
| Alberta | 14.5 | 21 | 12.2 | 5 | 0.8 | 0 | 8.4 | 2 | 0.3 | 0 |
| British Columbia | 9.5 | 41 | 10.0 | 5 | 0.5 | 0 | 0.6 | 0 | 5.2 | 0 |
| Yukon | 0.0 | 0 | 0.0 | 0 | 0.0 | 0 | 0.0 | 0 | 0.0 | 0 |
| Northwest Territories | 0.6 | 0 | 0.2 | 0 | 0.5 | 0 | 2.1 | 1 | 0.4 | 0 |
| Nunavut | 0.0 | 0 | 0.0 | 0 | 0.0 | 0 | 0.0 | 0 | 0.0 | 0 |
| Occurrences | 40.8 | 92 | 39.6 | 13 | 4.4 | 0 | 24.8 | 3 | 7.7 | 7 |
Data extracted 15 February 2022 |
||||||||||
Definitions
Before 1 July 2014
Before 1 July 2014 (under the previous TSB Regulations), pipeline transportation accidents and incidents were defined as follows:
Pipeline accidents
Reportable commodity pipeline accident means an accident resulting directly from the operation of a commodity pipeline, where
- a person sustains a serious injury or is killed as a result of being exposed to
- a fire, ignition or explosion, or
- a commodity released from the commodity pipeline, or
- the commodity pipeline
- sustains damage affecting the safe operation of the commodity pipeline as a result of being contacted by another object or as a result of a disturbance of its supporting environment,
- causes or sustains an explosion, or a fire or ignition that is not associated with normal operating circumstances, or
- sustains damage resulting in the release of any commodity.
Pipeline incidents
Reportable commodity pipeline incident means an incident resulting directly from the operation of a commodity pipeline, where
- an uncontained and uncontrolled release of a commodity occurs,
- the commodity pipeline is operated beyond design limits,
- the commodity pipeline causes an obstruction to a ship or to a surface vehicle owing to a disturbance of its supporting environment,
- any abnormality reduces the structural integrity of the commodity pipeline below design limits,
- any activity in the immediate vicinity of the commodity pipeline poses a threat to the structural integrity of the commodity pipeline, or
- the commodity pipeline, or a portion thereof, sustains a precautionary or emergency shut-down for reasons that relate to or create a hazard to the safe transportation of a commodity;
Since 1 July 2014
On 1 July 2014, new reporting provisions of the TSB Regulations came into effect; additional clarifications came into effect on 1 January 2019 with respect to these regulations. According to section 4(1) of the TSB Regulations, the operator of a pipeline must report any of the following pipeline occurrences to the Board:
- the pipeline sustains damage that affects the safe operation of the pipeline as a result of another object coming into contact with it;
- an unauthorized third party activity affects the structural integrity of the pipeline;
- a geotechnical, hydrotechnical or environmental activity poses a threat to the safe operation of the pipeline.
Under section 4(1.1), the operator must report any of the following pipeline occurrences to the Board if they result directly from the operation of the pipeline:
- a person sustains a serious injury as defined in section 1 of the National Energy Board Onshore Pipeline Regulations or is killed;
- there is a fire, ignition or explosion that
- affects the safe operation of the pipeline, or
- poses a threat to the safety of any person, property or the environment;
- there is an occurrence that results in
- an unintended or uncontrolled release of hydrocarbon gas,
- an unintended or uncontrolled release of HVP hydrocarbons,
- an unintended or uncontrolled release of LVP hydrocarbons in excess of 1.5 m3, or
- an unintended or uncontrolled release of a commodity other than hydrocarbon gas, HVP hydrocarbons or LVP hydrocarbons;
- there is a release of a commodity from the line pipe body;
- the pipeline is operated beyond design limits or any operating restrictions imposed by the National Energy Board;
- the pipeline restricts the safe operation of any mode of transportation.
Pipeline accidents
A pipeline accident is an occurrence resulting directly from the operation of a pipeline that results in:
- serious injury or loss of human life;
- a rupture (an instantaneous release that immediately affects the operation of a pipeline segment such that the pressure of the segment cannot be maintained);
- a fire, ignition or explosion that poses a threat to the safety of any person, property or the environment; or
- an unintended or uncontrolled release of commodity which results in a significant adverse effect on people or the environment (a release of any chemical or physical substance at a concentration or volume sufficient to cause an irreversible, long-term, or continuous change to the ambient environment in a manner that causes harm to human life, wildlife, or vegetation).
Pipeline incidents
A pipeline incident is
- an occurrence in which
- the pipeline sustains damage that affects the safe operation of the pipeline as a result of another object coming into contact with it,
- an unauthorized third party activity affects the structural integrity of the pipeline, or
- a geotechnical, hydrotechnical or environmental activity poses a threat to the safe operation of the pipeline;
- an occurrence resulting directly from the operation of a pipeline in which
- there is a fire, ignition or explosion that affects the safe operation of the pipeline,
- there is an unintended or uncontrolled release of hydrocarbon gas,
- there is an unintended or uncontrolled release of HVP (high vapour pressure as defined in CSA Z662. CSA Z662 means Canadian Standards Association Standard Z662 entitled Oil and Gas Pipeline Systems, as amended from time to time) hydrocarbons,
- there is an unintended or uncontrolled release of LVP (low vapour pressure as defined in CSA Z662) hydrocarbons in excess of 1.5 m3,
- there is an unintended or uncontrolled release of a commodity other than hydrocarbon gas, HVP hydrocarbons or LVP hydrocarbons,
- there is a release of a commodity from the line pipe body,
- the pipeline is operated beyond design limits or any operating restrictions imposed by the Canada Energy Regulator, or
- the pipeline restricts the safe operation of any mode of transportation.