Table of contents
1.0 Introduction
1.1
On 06 July 2013, shortly before 0100 Eastern Daylight Time, eastward Montreal, Maine & Atlantic Railway freight train No. 2, which had been parked for the night at Nantes, Quebec, started to roll uncontrolled. The train travelled a distance of about 7.2 miles, reaching a speed of 65 mph. At about 0115, while approaching the centre of the town of Lac-Mégantic, Quebec, 63 tank cars carrying petroleum crude oil, UN 1267, and 2 box cars derailed. As a result of the derailment, about 6 million litres of petroleum crude oil spilled. There were fires and explosions, which destroyed 40 buildings, 50 vehicles and the railway tracks at the west end of Megantic Yard. A total of 47 people were fatally injured.
1.2
The Transportation Safety Board of Canada’s (TSB) Engineering Laboratory was asked to perform a site survey, and to calculate the track grade.
2.0 Examination and analysis
2.1
A survey of the site was performed using a Trimble S6 semi-robotic total station and an Altus APS-3 differential global positioning system (GPS). The survey included data points on the track, the intersecting roads, and the terrain.
2.2
The survey data was started at rail mile (RM) 8.40 on the Sherbrooke Subdivision at the Rang Saint Joseph level crossing in Nantes, QC, and continued to just past the level crossing at Rue Victoria in Lac-Mégantic, QC, to the edge of what was defined as the “Red Zone” at RM 0.41 which was a zone around the occurrence site in which the survey equipment could not be taken due to the environmental conditions. The survey was then continued from the opposite edge of the “Red Zone” at the Rue de la Gare located at RM 117.11 on the Moosehead Subdivision to where the locomotives were located just past the Rue Agnès level crossing at RM 116.40.
2.3
The survey points were captured every 10 meters with additional points captured at significant markers, such as rail miles and crossing boundaries. Post-processing of the RAW GPS data was performed to obtain better absolute accuracy of the GPS point positions. Then within mapping software, the data had a polyline fit through all of the data points and an interpolation was made on this line to capture points every meter.
2.4
An independent survey company performed a differential GPS survey over approximately 1.5 miles of track with points captured every 30 m; this data matched the survey data gathered by the TSB to within about 4 cm. The good correlation of the two independent data sets validates the data and indicates that the TSB gathered data was accurate.
2.5
Digital elevation model (DEM) mapping data was used to fill in the missing “Red Zone” data between the two surveyed sections. This data is not as accurate as surveyed data, but over the small distance covered and minimal elevation shift within that distance, the DEM data had sufficient resolutionFootnote 1 to be able to be used confidently with the rest of the surveyed data.
2.6
A plot of the survey data was overlaid on top of a map to illustrate the surveyed points and is included as Figure 1. The figure includes the TSB surveyed data, the contractor’s surveyed data, and the DEM data. The rail miles along with the initial train position and final resting position of the locomotive consist were labelled.
2.7
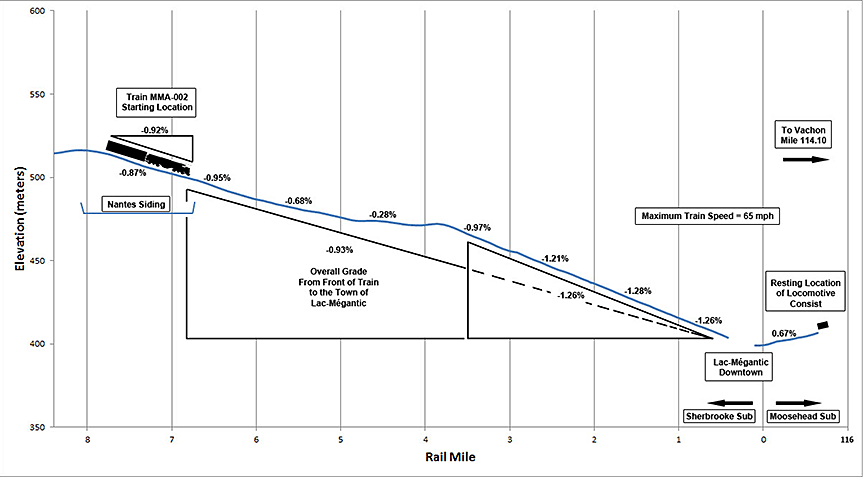
The grade was then calculated between each of the surveyed data points. This grade is shown in Figure 2. Included on this figure is the grade between each rail mile as calculated from the surveyed data, the grade from rail mile 3.5 to the start of the “Red Zone” on the Sherbrooke Sub, and the grade of the track over which the train was originally resting.
2.8
An averaged grade over 10 m increments was also calculated to be used in LP187/2013 for brake force analysis. Specific grades over various distances were requested by the investigator-in-charge (IIC). The grades were requested to RM 0, but grades were also calculated to the point with the lowest elevation as RM 0 was slightly elevated from the lowest point; the lowest point occurred at about RM 0.11 on the Sherbrooke Sub. The grade was also requested from the start of where the locomotive ended up on the Moosehead Sub to the lowest point; the point where the locomotive ended was determined to be RM 116.41 in the surveyed data. The grades between various other points were also requested. All of these grades are summarized in Table 1.
| StartFootnote 2 (Rail Mile/Subdivision) |
End (Rail Mile/Subdivision) |
Grade (%) |
|---|---|---|
| 7.40 (S) | 0.00 (S) | -0.914 |
| 3.75 (S) | 0.00 (S) | -1.193 |
| 7.40 (S) | 0.11 (S) | -0.936 |
| 3.75 (S) | 0.11 (S) | -1.246 |
| 116.41 (M) | 0.00 (S) | -0.759 |
| 116.41 (M) | 0.11 (S) | -0.725 |
| 1.34 (S) | 0.41 (S) | -1.273 |
| 1.04 (S) | 0.11 (S) | -1.080 |
2.9
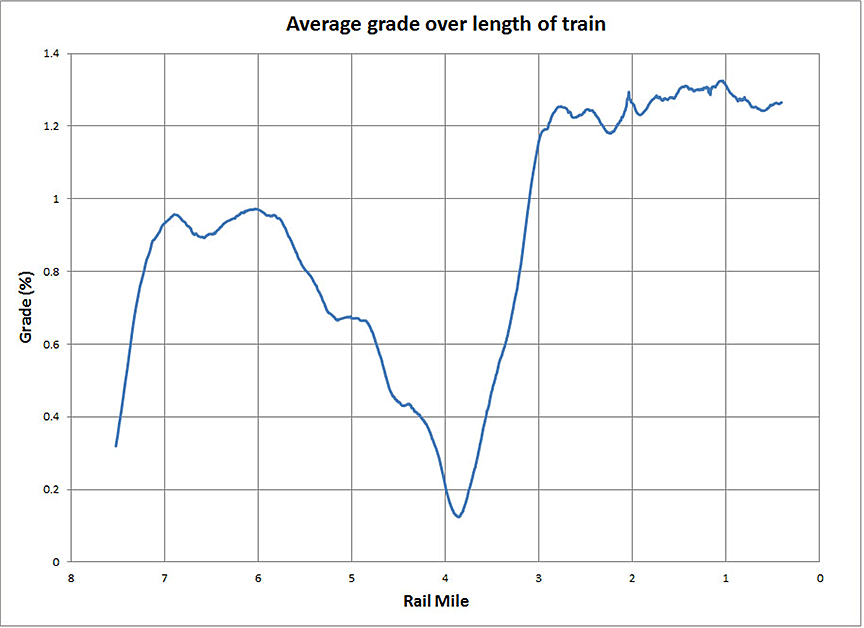
The grade over which the train was initially sitting while stationary was calculated to be -0.915% from the back end of the train to the front (towards Lac-Mégantic); this was a calculation based on a train length of 1440 m. The average grade from the start position down to the start of the “Red Zone” over the length of the train is included as Figure 3.
2.10
From the plot it can be seen that the steepest portion of the track is the last 3.5 miles leading to the town of Lac-Mégantic with a grade averaging -1.26%. The maximum grade, averaged over the length of the train, was 1.32% and occurred at mile 1.03 on the Sherbrooke Sub.
2.11
An additional plot of the grade was created with specific information for the IIC such as additional labels and grades at specific points. This was included as Figure 4.
3.0 Conclusion
3.1
A survey was performed at the Lac-Mégantic occurrence site mapping approximately 9.2 miles of track.
3.2
DEM data was incorporated into the survey dataset to fill in the gaps in the data where it was not possible to use survey equipment.
3.3
Grade calculations were completed for analysis by the investigation team.
3.4
The train started on an average grade of -0.915% prior to its roll towards the town of Lac-Mégantic.
3.5
The average grade from the start of the train to the town of Lac-Mégantic was -0.93%.
3.6
The last 3.5 miles leading to the town of Lac-Mégantic had an average grade of -1.26%.
3.7
The maximum grade, averaged over the length of the train, was 1.32% and occurred at mile 1.03 on the Sherbrooke Sub.
This lab report is part of the Transportation Safety Board of Canada's investigation report R13D0054.


